

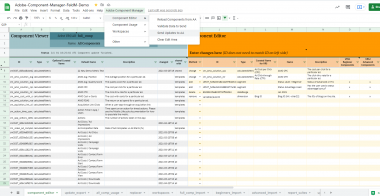
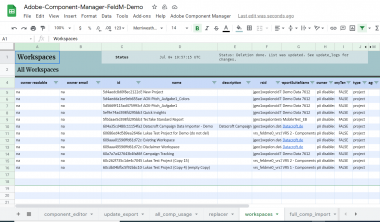
Load all Adobe Analytics components into a Google Sheet with two clicks

Filter by usage frequency, date modified, type, etc. - edit - replace - delete

Full admin control and user-friendly, tidy Adobe Analytics interface
This is how it works:
One of the strengths of Adobe Analytics lies in its many components that can be quickly created for each use case – the Segments, Calculated Metrics, Date Ranges, and Workspaces. However, these can quickly grow into thousands and confuse users and admins. It’s also easy to lose track of the dimensions (eVars/props) and metrics (Success Events).
All Adobe Analytics admins are therefore plagued by questions like:
- How do we get an overview of all our components?
- The half-life of most components is short. But which ones can be deleted? Which ones are no longer used at all?
- Which components are still being used, even though they really shouldn’t be? Do the Segments we show in the trainings resonate?
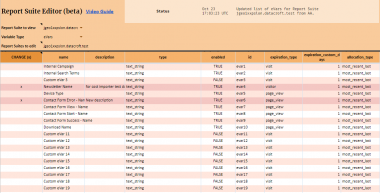
- Which eVars, props or Success Events could we remove from the implementation because they are not used anywhere (in any Workspace/Segment/Calculated Metric)?
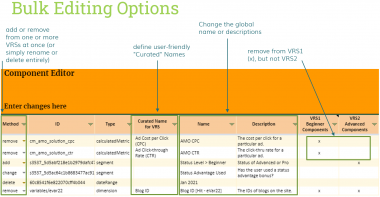
- How do we efficiently establish a unified naming convention for Segments and Calculated Metrics?
- It gets even harder when managing curated components with user-friendly names for multiple Virtual Report Suites – yet this is the approach that is ideal for acceptance by non-technical users.
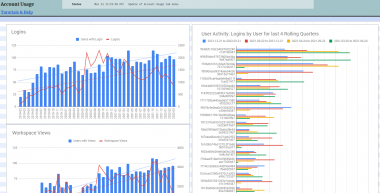
- Which Workspaces get the most attention (views and active schedules)? Which ones did we build in vain?
- How are Logins and Workspace views trending over time? Which users are becoming Power Users? Which ones are churning? Which ones haven’t logged in in ages?

Over 30 clients drastically reduce their Adobe Analytics Administration costs with the Component Manager. Among them:


The Component Manager cleans up:
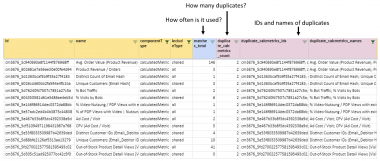
- Analyse component usage: In how many Workspaces/Segments/Calculated Metrics is a component used? Which components are duplicates?
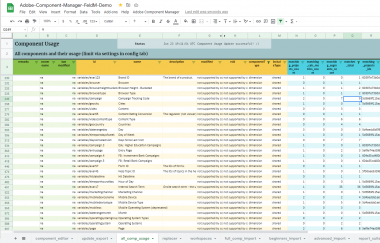
- See all components and Workspaces in a clearly layed out Google Sheet and edit or delete them in bulk
- Data democratisation: See whether users use the new components that you recently introduced and implement naming conventions efficiently
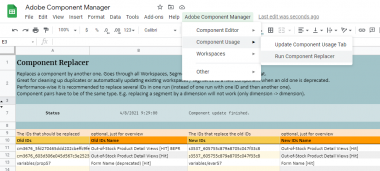
- Automatically replace component A with B (in Workspaces, Segments and Calculated Metrics).
- Add/remove/rename curated components in multiple Virtual Report Suites at once
- Monitor account usage trends and identify churning users
- Compare Variables across Report Suites and edit or disable/enable eVars, props & Success Events in bulk and across multiple Report Suites at once
- Everything is in one GoogleSheet, so it is possible to build any additional extensions of your own (e.g. with formulas)
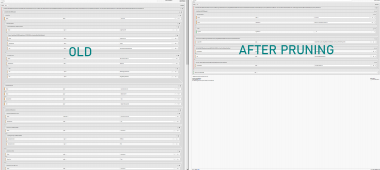
- Segment Pruner: Large segments (e.g. for Bot Filters in Virtual Report Suites) with many conditions can massively slow down your Adobe Analytics reporting performance. The Segment Pruner shows you the smallest possible alternative to a segment without any dreadful manual work.
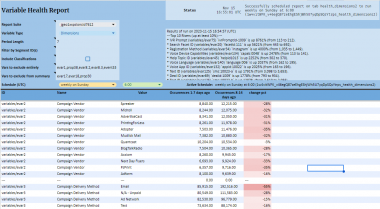
- Variable Health Report: One Adobe Analytics account, so many eVars, props & Metrics to keep an eye on. The Health Report looks at all of them regularly and summarizes the biggest changes – even in a Slack channel! Weekly or daily schedules included.
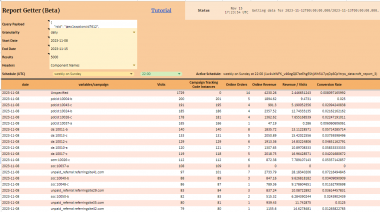
- Report Getter: You’d like your Adobe Analytics reports somewhere else, but there is no AA connector for that? Sure there is a Google Sheets integration for it! So why not get your Adobe Analytics reports into your Google Sheet, and then benefit from the wealth of Google Sheets integration options! Daily/weekly scheduling included.
Contact us to learn more.

Thank you very much for your request
We will get in contact with you shortly.